As a website owner, you've likely heard that Page Speed is an important factor to consider on your site. But you might ask yourself, why? How does it impact my business? To put it in Google’s own words 'Speed Equals Revenue.' How does it affect your bottom line? It boils down to two distinct methods:
Google uses Page Speed in its search rankings. Putting it simply, slower sites are ranked lower in their search results than faster sites. This is incredibly important since organic search results are most often the primary source of traffic on a site. Ranking behind your competitors in page speed can negatively impact your revenue stream.
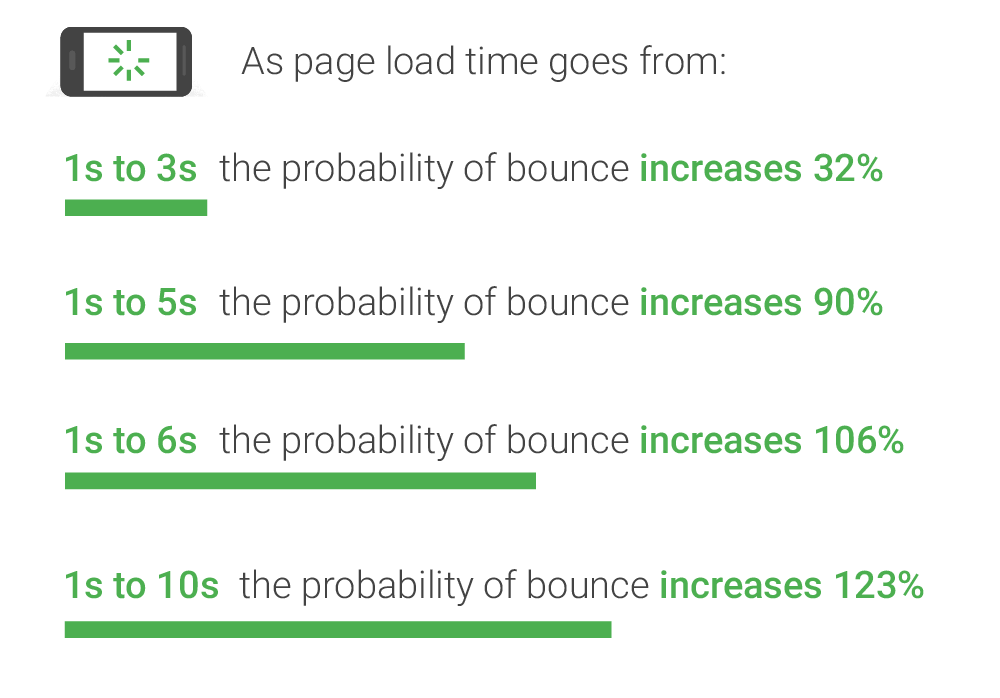
A poor user experience leads to higher bounces rates and lower conversion rates. Many studies show users are less likely to return to your site after a bad user experience. They’re more likely to leave a slow-loading site for a competitor’s site. Check out Google’s research:
If your site is slow and your visitors are leaving, it’s simple to estimate your revenue loss:
(Monthly Traffic * Estimated Visitor Loss %) * Conversion Rate = Estimated Conversion Loss
If you know how much each conversion is worth to your business, you can quickly see the lost revenue:
Conversions Lost * Conversion Value = Estimated Revenue Loss
Understanding that a poor Page Speed can drain revenue from your company, the next logical step is to determine, what is Page Speed? And more importantly, how can we improve it? In our Page Speed articles, we’ll attempt to answer these questions.
What is Page Speed?
The term ‘Page Speed’ refers to the length of time it takes for all the content on a specific page to be downloaded from the web server(s) hosting a website and for this content to be displayed in your browser. Think of it as the amount of time between clicking the link and seeing the page displayed.
During this time, dozens of different elements are typically transferred from the server to your device. This typically includes the page HTML, CSS, JavaScript files, font files, and images. After downloading each element, your browser needs to read and interpret them to determine where on the page they go and how the page is to interact with the user.
How long it takes for the browser to complete both tasks, downloading files and then rendering them, is your Page Speed.
How does Google calculate your Page Speed score?
This is a much more complex question than simply counting the time between ‘clicking’ and ‘seeing’. While many different tools are used to measure overall Page Speed, Google combines two different methods to help it determine your overall speed ranking, Performance Score and Field Data. Both metrics are displayed on their Page Speed Insights testing page.
Understanding the difference between lab data and field data is vital if you want to understand how Google ranks your Page Speed.
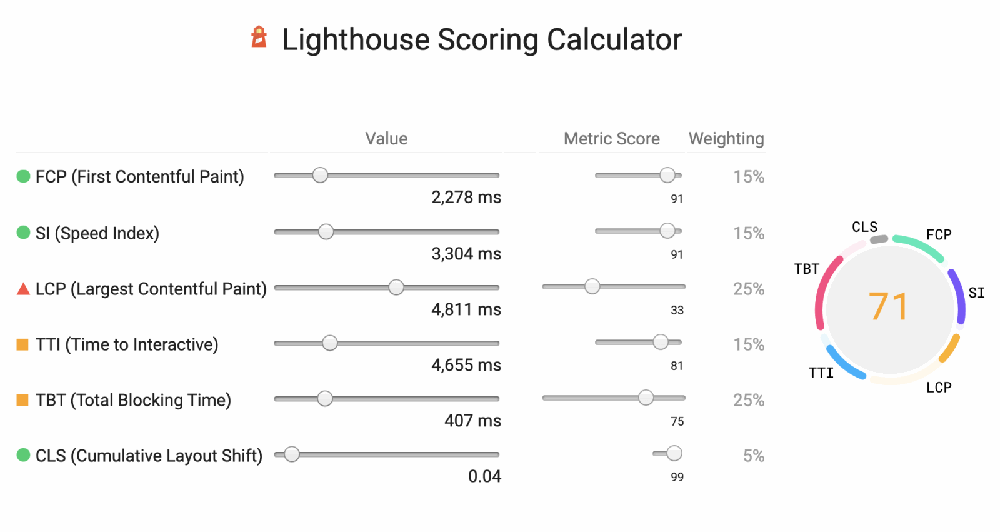
Lab Data (also known as ‘Performance Score’)
Google defines their lab data as “performance data collected within a controlled environment with predefined device and network settings.” But what does this mean?
Google uses a tool called Lighthouse to collect and analyze performance metrics for a single page load, tested on demand when you run the report. Since this is a one-time request, factors such as network traffic, server load, or even different ads being served on a page at the time of the request can significantly impact the score.
Google calculates their mobile scores by simulating how they will render on a mid-tier device (currently a Moto G4, first released in May 2016) running on a fast 3G or slow 4G mobile network. You may wonder why Google would use such an old device, but they do have a reason.
They have determined that the ‘average’ web user, across the globe, is using a device in this range and on this network speed. Increasing page size or adding heavy JavaScript action will negatively impact the ‘average’ user more than it might someone on a brand-new device or 5G network. This is critical to note since the total ‘weight’ of pages sent to mobile devices has more than quadrupled over the last few years, with many web pages now over 4 MB.
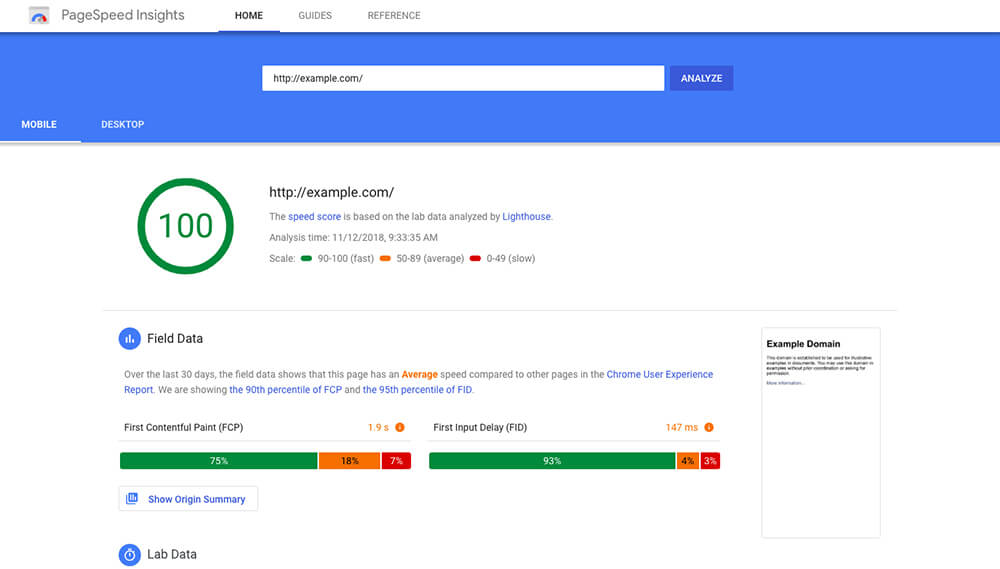
Field Data (also known as ‘Real User Monitoring’)
Google uses real-world data collected using their Chrome User Experience Report. This data is gathered by Chrome users as they browse the web. As the user browses a specific web page, it records key metrics including First Contentful Paint (FCP), First Input Delay (FID), Largest Contentful Paint (LCP), and Cumulative Layout Shift (CLS). Google then aggregates this data from users over the last 28 days and classifies it into three buckets describing experiences deemed good, needs improvement, or poor.
Overall Page Speed Score
Google uses the combination of Lab Data and Field data to determine your overall Page Speed score. A different score is given for both mobile and desktop devices. When developing your web page, it's important to ensure that your pages are optimized for both sets of users.
Is my score good enough?
Now that you have your overall score from Google, you’re likely asking yourself this question. Although it’s technically possible to achieve a score of 100, there are almost always trade-offs a site owner may need to understand before deciding on a specific number.
In our next Page Speed article, Moonstone will describe our approach to setting a target Page Speed score for your site and provide some recommendations on how to improve your overall Page Speed. Interested in improving your Page Speed? Let's chat about how we can help you increase your score.